As a result, the demand for producing high-performing applications is also increasing. And to produce a successful app that users can’t get over with, you need to ensure it performs efficiently without giving a hard time to users.
But how would you know that?
Is there a way to determine whether or not the users are happy with your app?
Yes, there is a way – by using Application Performance Monitoring (APM) software.
APM software plays a significant role in making sure the app performance is solid and meets user expectations. It can identify issues and notify you so you can make quick fixes and improve its performance.
In this article, we’ll dive deeper into what APM software is all about, its benefits, and the top open-source APM software to help you monitor, troubleshoot, and optimize your apps.
Let’s jump in!
What is APM Software?

Application performance monitoring (APM) software is a tool that can monitor and track an application’s performance to identify performance issues quickly and solve them.
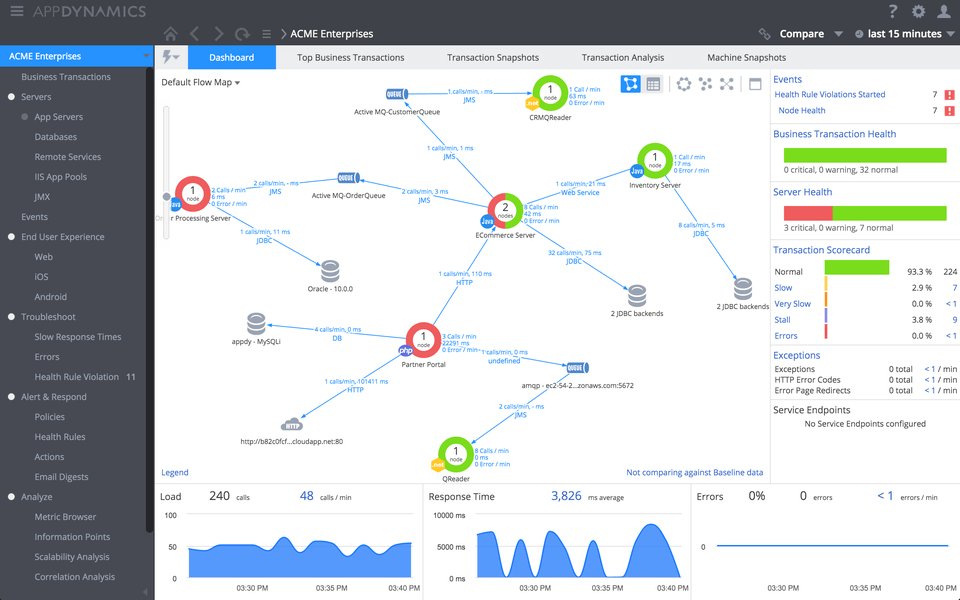
An APM solution shows app performance metrics with insights such as the volume of transactions it processed, response times, request rates, error rates, application availability, and more.
The software displays all the metrics in different types of data visualizations in a clear dashboard to detect issues quickly before the users do. APM solutions are used mainly by app administrators and developers to manage applications, find out possible reasons for errors, and troubleshoot them to optimize the user experience.
Why Do You Need Application Monitoring Software?
If you deal with application development and deployment, APM software is a must-have for your organization regardless of its scale or type of project. It executes intensive monitoring, collects logs, and converts them into valuable insights to improve your app performance.
Here are some of the benefits of using APM software:
- Clearer visibility into applications: If you use a powerful APM tool and implement it well, it will provide clear visibility into the applications existing in your complete tech stack. It will highlight how they perform, where they are located, and what devices users use to access them. In this way, you can learn the bottlenecks and map user satisfaction to improve its performance.
- Meet customer expectations: Using APM software makes your organization more customer-centric and indicates that you care about the end-users. With high visibility, the more issues you can catch, the more improvements you can make to meet the user expectations and elevate your brand reputation.
- Better security: By identifying issues and improving them sooner, you are making your application stronger. In this way, your applications won’t be vulnerable enough to let hackers exploit them. As a result, you will make your app more secure and compliant with regulations while maintaining the end-user trust.
- Accelerate innovation: If you can reduce the time required to solve issues by monitoring apps using APM solutions, your team will get more time to spend on innovation. They can research and experiment with adding new functionalities rather than just fixing bugs or investigating the cause all the time.
- Manage IT costs: APM software helps manage your IT costs better as you can leverage its powerful insights to make informed decisions. It can predict how application usage varies and helps you manage your resources, including your IT infrastructure, tools, and employees. As a result of automation, you can also optimize your team’s efficiency and operating cost and boost ROI.
Apart from all these, APM software can also help enhance app development lifecycle, understand dependencies, audit code execution, monitor network performance, and more.
Now, when you search for APM software, you will get plenty of them, both free and paid. You may find many cloud APM; however, some open-source APM solutions are also fantastic and in no way lesser.
So, let’s look at some of the best open-source application performance monitoring (APM) tools to help you monitor your apps, find issues, and fix them to deliver the best possible user experience.
SigNoz
Understand the issues in the deployed applications and solve them promptly with an open-source platform – SigNoz. Don’t worry about the GDPR and other regulatory laws for data protection, as every monitoring and tracing data remains within your boundary.
SigNoz gives you access to transparent usage data to save you from unexpected bills. Extend Signoz’s features to fulfill your needs without spending long hours getting a single element from vendor slack. Get your full metrics in a single window and trace the issue faster without shifting to another system.
Video Player
00:00
02:55
The cost for data storage depends on application load and doesn’t depend upon the factors like the number of nodes, etc. You do not even need any compliance to use the service or face many rounds with security teams.
The tool integrates with OpenTelemetry, an emerging industry standard for the instrumentation process. You can set your sample rate and retention period as per your needs and monitor your usage accordingly. Plus, you will get industry-trusted Druid and Kafka, which helps you in handling enterprise scale.
SigNoz is built on Goland and React-Typescript, which many developers love. You can get the benefit of filtering the data based on what you want to review. Get a complete guide to set it up on your system for FREE. Also, there is an enterprise edition with more advanced features like RBAC, SSO, etc., for bigger teams.
Apache SkyWalking
If you are a distributed team looking for a tool for monitoring your application performance, try Apache SkyWalking. It is an application performance management system and observability analysis platform designed for cloud-native, microservices, and cloud-based (Mesos, Kubernetes, Docker) architectures.

SkyWalking provides tracing, logging, metrics, and browser monitoring under one solution. It supports multiple languages like Golang, .Net Core, Python, Java, C++, PHP, Lua, and NodeJS. SkyWalking provides an adapting scale with no big data stack. It also offers modular features like cluster coordinator pluggable, storage pluggable, and push/pull transportation.
Get notified with Slack notification, alarm HTTP/gRPC forwarder, WeChat notification, Dingding notification, and data exporter for raw metrics. Access every data in a single window with a fancy visualization like topology map, CLI dashboard, IntelliJ IDE plugin, side by side metrics with codes, customizable dashboard option, and profile and trace explorer.
Metrics
Measure the performance of critical components with a powerful monitoring toolkit by Metrics in the production environment. It offers you full-stack visibility with the modules for libraries like Logback, Log4j, Jetty, Apache HttpClient, JDBI, Ehcache, Jersey, and backends like Graphite.
Metrics provides different measuring instruments to help you monitor every piece of data. Metrics-core library is a must that you need to determine the behavior of your critical components. You will also get Metrics version 4.2.0 property that is declared in the POM. Besides, Meters play a vital role as it measures the rate of events over time like requests per second.

Metrics also tracks 1, 5, and 15-minute moving averages. Console Reporter lets you access reports which you will receive every second. The MetricRegistry class is the centerpiece used to store each application’s metrics, while Gauges are used to measure the value instantly. It helps in running the number of works in the queue.
Furthermore, Counters are also in the list that is similar to Gauge but used to increment and decrement the value. Metrics presents data in histograms that show the statistical distribution of the data and maximum, mean, minimum, etc. With the timer, you can measure the time needed to process a request.
The Metrics-health checks module is used to centralize service health, while the Metrics-JMX module is used as a dependency. Once started, you can see the registry via VisualVM and JConsole.
Hypertrace
Hypertrace is a platform for observability and distributed tracing built to help SREs and Devs. You can trace distributed transactions, monitor microservices and native applications, identify critical dependencies for applications, perform root cause analysis, and optimize service and application performance.

Hypertrace helps you visualize the application architecture. It includes service, backend, and global dashboards that allow the teams to look into the objectives to respond faster. It stores, prepares, and aggregates data for analysis and visualization.
You will get actionable insights to improve application performance using charts, reports, customizable dashboards, and flow maps. Hypertrace is engineered by the Traceable team and is backed by community support.
AppPerf
AppPerf helps you to monitor the app performance, which is easy to use and set up. It supports various languages like JavaScript, HTML, Dockerfile, HTML, Ruby, PLpgSQL, and CSS.

Before setting up AppPerf, make sure you have Node, Yarn, PostgreSQL, Mailcatcher, etc., installed well and functioning correctly. AppPerf has a sample account that will allow you to check the application effectively. It will automatically detect the latest applications that are showing data and display them on the Applications page.
You can visit each page to visualize the metrics. Add Ruby Agent gem to Gemfile for monitoring the application. You can also get a license key by visiting the applications tab and add metrics to AppPerf more straightforwardly, just like posting data to endpoints.
Pinpoint
Pinpoint is an APM tool suitable for large-scale distributed systems. It supports languages such as TypeScript, CSS, HTML, SCSS, Java, and more.
Pinpoint supports applications written on Python and PHP. It provides a way inspired by Dapper to help in the analysis of the overall structure and how components are interconnected within them through tracing each transaction across diverse applications.

Pinpoint helps you understand application topology, monitor the application in real-time, gain visibility in each transaction, and have minimal impact. ServerMap helps you view transaction count and current status by clicking on the node to reveal the details.
You will get an active thread chart in real-time for monitoring it inside applications. Also, visualize response patterns and request count over time for identifying potential problems. Furthermore, you can view additional details like CPU usage, TPS, JVM arguments, and Garbage/Memory collection.
Stagemonitor
If you are looking for an open-source application performance monitoring solution that works great for java server applications, Stagemonitor is a good option. You can establish it on your data center and turn on the private mode. It uses Open Tracing API to correlate requests on a distributed system.
Stagemonitor is built for development, production, and QA by bringing Ops and Devs together. You can manage it to alert channels and subscriptions and define thresholds for metrics. It is also reliable in providing necessary insights constantly for improvements.
Stagemonitor allows you to extend its functionalities; you can use standard plugins or third-party plugins, track your metrics, and customize or create dashboards. The widget, which is a small Stagemonitor icon, is injected automatically in the monitored webpage if activated.
It helps developers give instant feedback regarding the poor performance of an application. You do not need any visualization tools or databases to check graphs and tables in real-time, as Stagemonitor has got you covered. The call tree view tab displays the current requests, including statements from the SQL, to identify the line of the recommendations.

Similarly, the Request trace tab helps you get detailed information on the server processing, page rendering time, DOM processing, and breakdown of the page’s load time into the network. Stagemonitor gives you a Kibana dashboard, so you don’t need to configure logstash and parse any logs.
Now, you can also filter your requests by choosing charts and queries that you want to see. It integrates with Graphite, InfluxDB, and Elasticsearch to gather a long history of the data points and store them. You will also find the Grafana dashboard, which is preconfigured and fully customizable.
Analyze AJAX requests, JDBC queries, page load time, and more in addition to the statistics for the HTTP requests. With the JVM dashboard, get all the information, including garbage collection behavior, CPU utilization, and heap utilization.
Furthermore, EhCache metrics give you information about cache size, hit rate, expiries, performance, and throughput. Apart from that, you can access server metrics like Thread Pool usage, concurrent sessions, tuning servers, and the server load.
Elastic APM
Find out where your app spends more time and fix the issue quickly with Elastic APM’s FREE application performance monitoring solution. Investigate critical metrics, summarize the service transactions and dependencies from the service overview page to understand the issue better.
Elastic APM’s UI uses the power of search to catch the bottlenecks on the changes once you start digging deeper. Get a clear-cut picture of how all the services are connected, visualize their performance with highlighted KPIs, and identify potential issues with health indicators.
In addition, you can zoom in on each service to check blockers, learn the outage impacts, and take proper action to maximize the performance of your application. String transactions altogether with the distributed trace are excellent for getting a clear-cut view of interacting services.

Check the utilization of the messaging frameworks and visualize the service calls to find the latency issues arising in the path and point to the components that need optimization. Test the code locally using multistep synthetic monitoring capabilities, and monitor the experience of the users live.
Enable machine learning from the APM application in Kibana to find unexpected behavior and problematic pieces. With the alerting features, always stay updated with the data and see how it is performing. Receive the notifications via Slack, PagerDuty, email, and more so that you will never miss anything important.
Elastic APM supports Python, JavaScript, PHP, Java, Ruby, .NET, Go, and Node.js applications. Additionally, it supports open standards like OpenTelemetry and Jaeger to make data sending from an existing application to Elastic APM easy.
Elastic APM is also available as SaaS.
Scouter
Scouter is like appdynamics and New relic. It helps you understand the context, i.e., “users use the application services, and services use the resources” to manage and monitor the application performance efficiently.
Scouter shows metrics about users like the recent user, active user, recent visitor, etc.; services like active service, response time, application profiles, etc.; and resources like memory, CPU, Heap, network usage, connection pools, etc.
Agents like Java Agent, Host Agent, and MariaDB Agent gather information on JVM performance and profiles metrics, Linux, OSX, etc. Plus, servers keep the performance metrics safe from agents or telegraf.
Scouter Web API helps get XLogs, counters, profiles, and other performance metrics through HTTP protocol. You will find many plugins for sample, alert, counter, and agent. Moreover, you’ll get a third-party agent like a pulse-type agent to gather performance metrics of RDS, EC2, ELB in AWS.
Glowroot
Glowroot is a Java APM that is very easy to install. Just download and unzip the zip file, add the path to the application’s JVM Argos, and point the browser to the link and see the result.
Here, you will get low overhead which depends on different factors. Low overhead means low microseconds because of the extensive tuning and micro benchmarking of Glowroot. Glowroot helps you gather all the root causes related to app performance and fix the issues in real-time.

Glowroot has many features like continuous profiling, trace capture for errors and slow requests, breakdown and percentile chart for response time, SQL capture, MBean attribute charts and capture, configurable alerting, and many more.
You will also get data on historical rollup with configurable retention, responsive UI, and complete support for async requests. Glowroot is tested on many application servers like TomEE, JBoss EAP, Jetty, Payara, WebLogic, WebSphere, Glassfish, Tomcat, etc.
Conclusion
Application Performance Monitoring (APM) software is an efficient solution to monitor what’s going on with your applications, how the users feel using it, and detect the issues it may have. Using these insights from the software helps you improve your application’s performance, which directly enhances the user experience.
Hence, try the open-source APM software we discussed above to meet user expectations while boosting your brand reputation and ROI.


