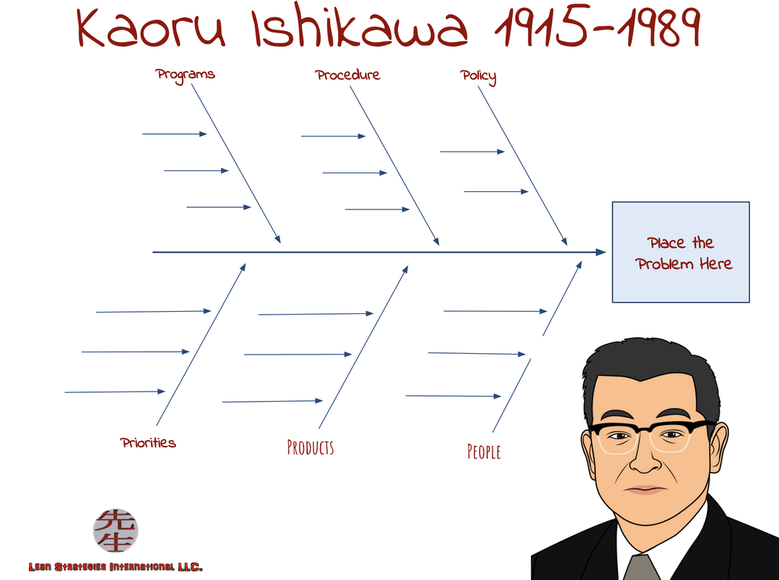
The Ishikawa diagram, also known as a fishbone diagram, is a useful tool in project management, particularly when it comes to quality control.
This diagram was created by Professor Kaoru Ishikawa to make brainstorming sessions more effective at conducting a thorough root cause analysis.
Conducting a proper risk analysis, anticipating and solving problems are essential management skills to lead successful projects. These aspects should be taken into account as soon as the project planning phase begins. Luckily, presenting the root causes of a challenge and the ways to overcome it is the very purpose of a fishbone diagram.
Learn more about the Ishikawa diagram, how it’s used in project management and how to build your own!
An overview of the Ishikawa diagram
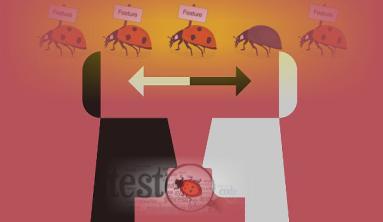
What are fishbone diagrams used for?
This diagram was created by Professor Kaoru Ishikawa to make brainstorming sessions more effective at conducting a thorough root cause analysis. After the project team has discussed a problem, it is used to sort all the ideas into categories.
Using this visualization allows your team to:
- Take a step back and think about a phenomenon or challenge,
- Communicate and share ideas more effectively,
- Make decisions more quickly.
Kaoru Ishikawa 11 Points
Mr. Ishikawa's philosophy of total quality management can be summarized by his 11 points:
- Quality begins and ends with education.
- The first step in quality is to know the requirements of the customer.
- The ideal state of quality control is when quality inspection is no longer necessary.
- Remove the root cause, not symptoms.
- Quality control is the responsibility of all workers and all divisions.
- Do not confuse means with objectives.
- Put quality first and set your sights on long-term objectives.
- Marketing is the entrance and exit of quality.
- Top management must not show anger when facts are presented to subordinates.
- Ninety-five percent of the problem in a company can be solved by the seven tools of quality.
- Data without dispersion information are false data.
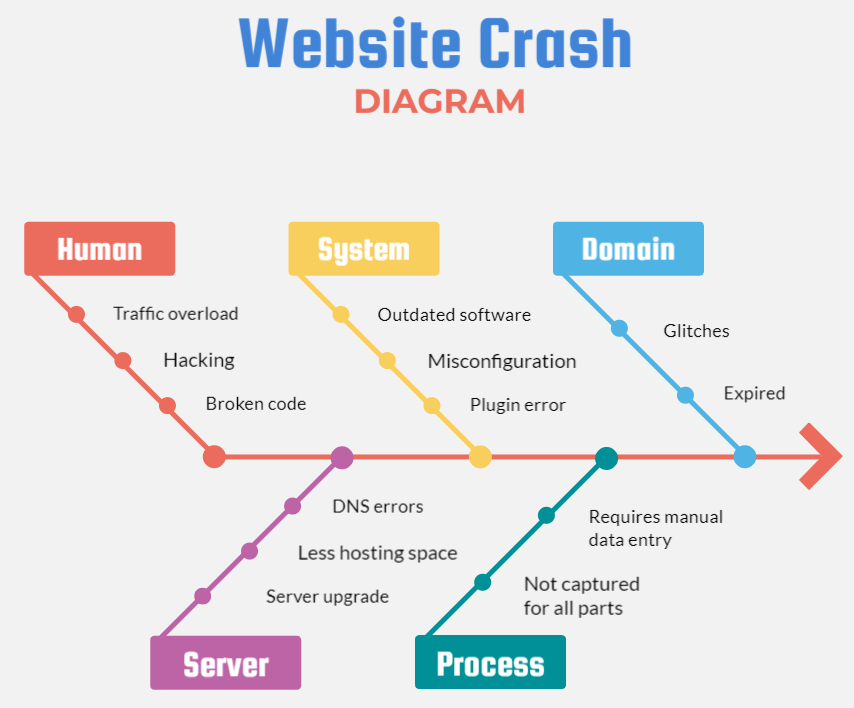
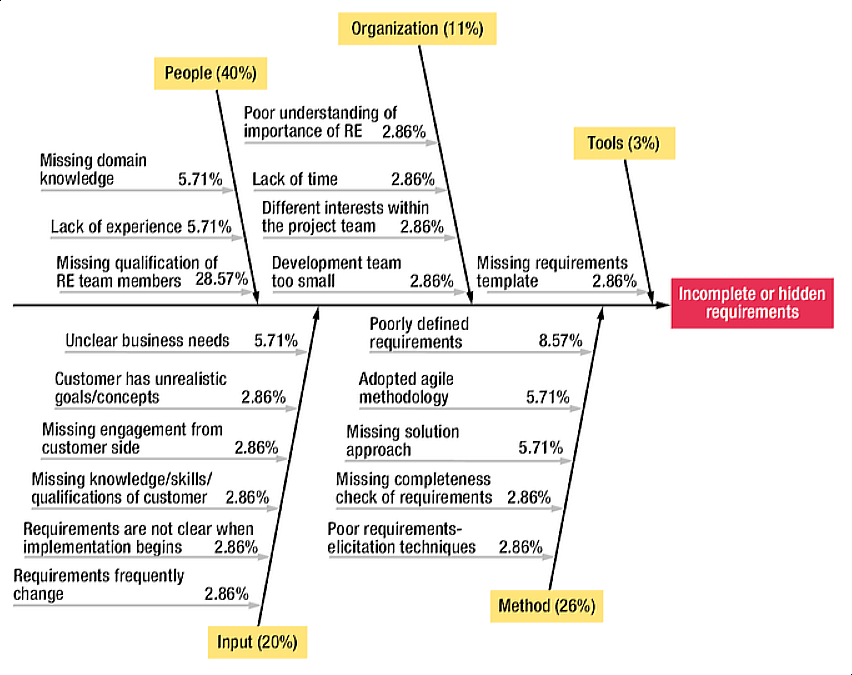
Ishikawa example:
How does a Ishikawa diagram work?
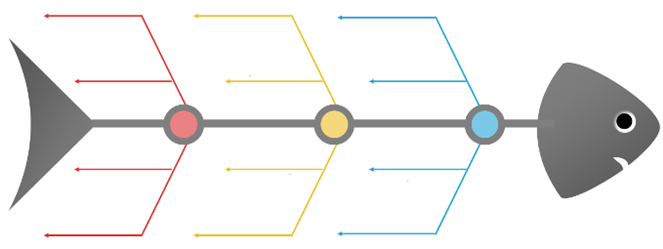
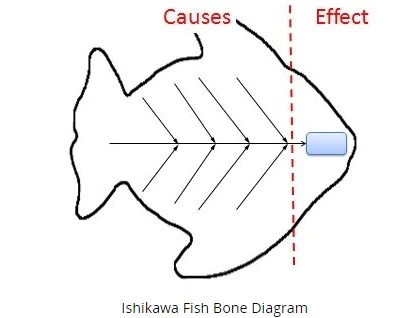
What makes this tool a favorite of project managers and quality professionals is its ease of use. It is simply read from left to right and can be used to collaborate with others on problem-solving.
This visual representation resembles fishbones and helps analyze the causes and consequences of a given problem. Therefore, some may call it a cause and effect diagram:
- The fishbones are oriented on the left-hand side and represent the causes,
- The head of the fish represents the final effect of the problem.
When should the Ishikawa diagram be used?
An Ishikawa diagram is a diagram that shows the causes of an event and is often used in manufacturing and product development to outline the different steps in a process, demonstrate where quality control issues might arise, and determine which resources are required at specific times.
Easier Root Cause Analysis for Remote Teams
One of the main challenges remote teams face when conducting root cause analysis is coordinating and communicating effectively. It can be difficult, primarily if team members are spread across different time zones.
Another challenge is ensuring that tasks or follow-ups are assigned to the correct person or team. In a remote setup, it’s easy to forget who’s responsible for what and to track tasks that aren’t assigned right away. However, there are tools like SafetyCulture that can help with this issue.
Via TIGO